
Succeeding in stock trading is only possible by making data-driven decisions, and part of that relies on having a tool that provides all the information you need without being overcomplicated. One of the most popular choices is the TradingView stock screener, which is constantly featured on sites like Investopedia and NerdWallet and boasts a fantastic 4.9-star rating across software review platforms.
TradingView has just released TradingView Stock Screener 2.0, and in this post, we’ll review this update to find out whether it lives up to its predecessor’s reputation and if this is the best stock analysis platform.
Who’s TradingView?
If you’re already in the stock trading world, you’re probably familiar with this company.
Founded in 2011, TradingView ranks among the top 130 websites globally according to Alexa and, in the company’s own words, is the #1 site in the world when it comes to all things investing.
It offers:
- A crypto and stock analysis platform with screeners, supercharts, and an economic calendar
- A social media platform with over 50 million traders and investors where they can find market insights, educational resources, and networking opportunities
- A stock trading platform where you can practice with paper trading and connect with over 600,000 brokers with verified user reviews once you’re ready for live trading
One of TradingView’s most notable aspects is its broad coverage, featuring stocks, coins, indexes, bonds, and ETFs from over 70 stock exchanges worldwide. That makes it perfect for those engaging in international stock exchanges, which led Investopedia to name it the best stock screener for this purpose.
TradingView Stock Screener 2.0 – Features
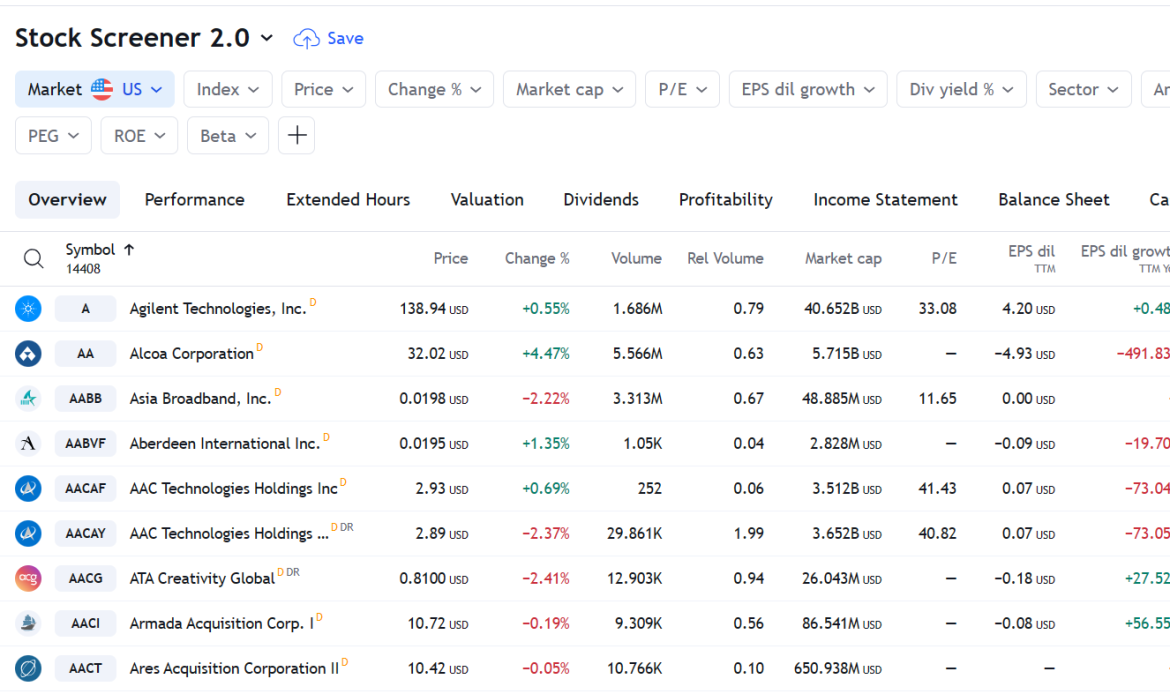
Screener
The platform offers a clean and intuitive interface and a mobile app so you can access the screener on the go.
The company has worked hard to ensure that even beginners not used to analyzing stocks can hit the ground running when using TradingView. For instance, it offers informative pre-made screen sets for those who don’t know where to start, such as Most Capitalized, Highest Cash, and High Capital Efficiency.
Additionally, it features a quick search dialog to find any tools and features across the platform and heatmaps that give users a visual overview of key asset classes, making it easier for them to find stock trends and other opportunities.
However, TradingView’s beginner-friendly nature doesn’t mean it’ll let experienced investors down.
The tool provides over 100 stock fundamentals, such as cash flow, return on assets, and market cap, as well as over 100 filter options, allowing you to customize your screening criteria as you wish.
Furthermore, its database includes quarterly and annual financial data from up to eight and 20 years ago, respectively.
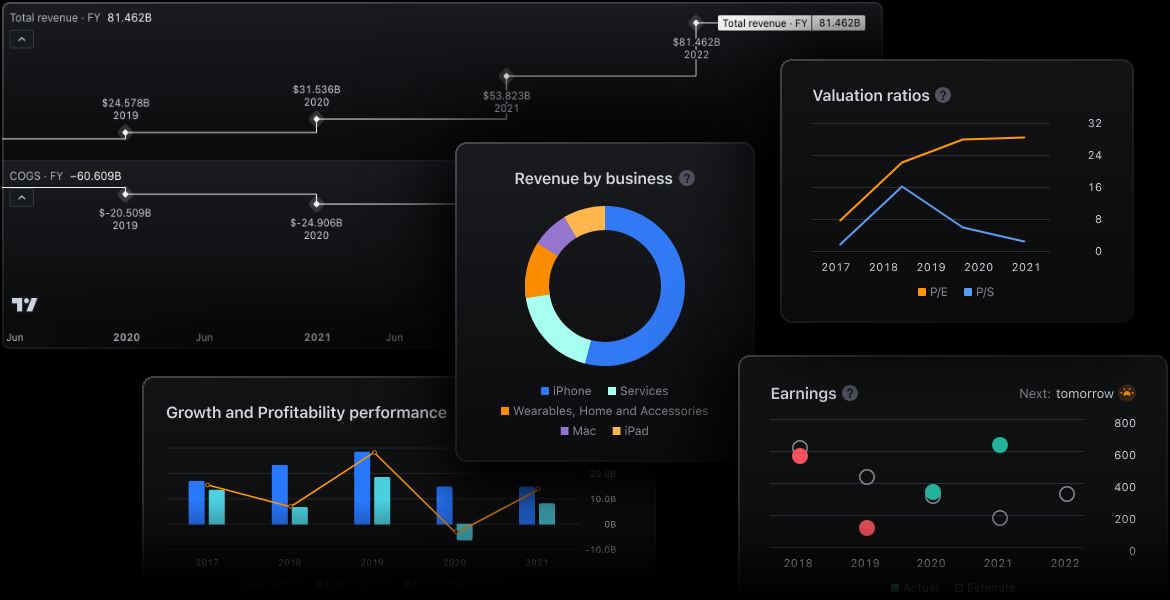
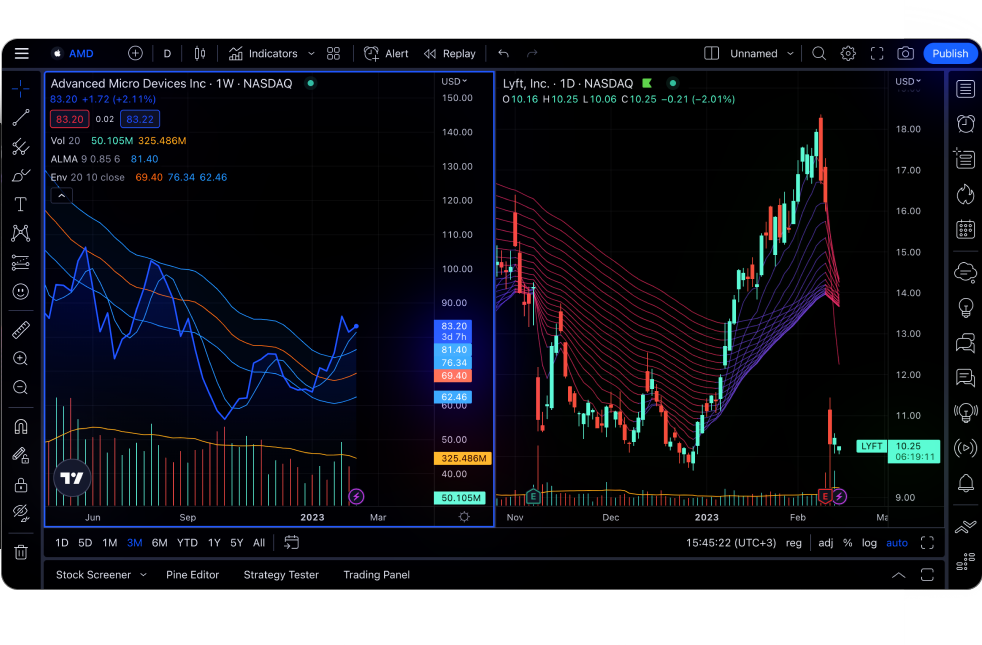
Charts
TradingView offers several charting features that enable users to run deep and customized analyses.
That includes over 15 customizable chart types, including unique options like Renko, Kagi, and Point & Figure, as well as traditional ones featuring bars, columns, and high-lows.
Additionally, there’s a chart synchronization feature that simplifies analysis by enabling you to synchronize symbols, time-frames, and even drawings from up to 16 charts, depending on your plan.
Furthermore, the Spreads functionality lets users create custom formulas using math operations to compare a financial instrument (such as a stock) and an additional variable. This feature has become popular due to its ability to mitigate risks and offer new insights.
Some of its most common applications include price inversions, currency conversions, and pairs trading.
Finally, TradingView allows users to create custom time-frames and set any time-based bar interval, including seconds-based ones, for tracking minimum price changes.
Alerts
Getting alerted about significant stock price variations enables traders to act promptly according to their strategies without having to check stock screeners several times a day.
TradingView helps with that too, allowing even free users to set up alarms based on 13 different conditions.
Here are some examples:
- Alert me if Meta crosses above $370.
- I want to know when Google goes up by $20 from the current price.
- Amazon is currently at $153. I think it will go down and then back up to $140, at which point I’ll buy because it’s an upward trend. So, I want to know when AMZN crosses $140 UPWARD.
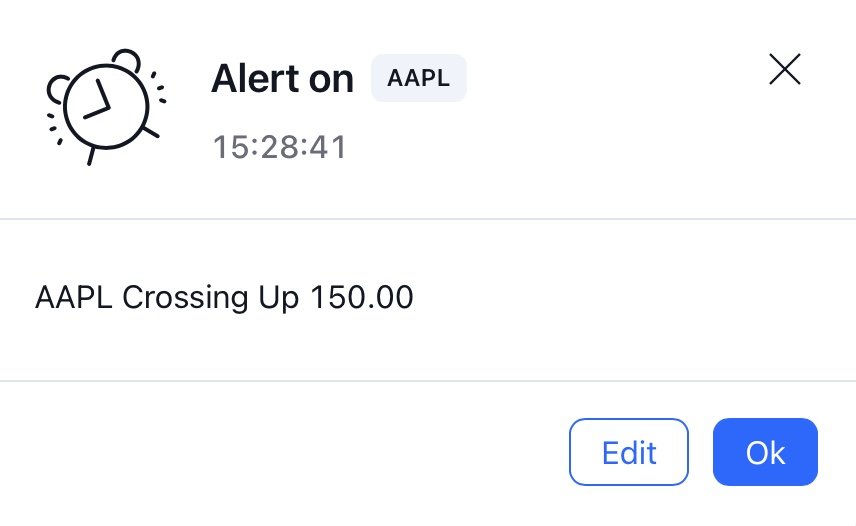
Notification options include visual popups, audio signals, email alerts, email-to-SMS alerts, and PUSH notifications.
Additionally, paid users can enjoy additional advantages, such as webhook notifications triggered when an alert is activated and integrations with other applications or platforms.
TradingView Stock Trader 2.0 pricing
TradingView doesn’t require registration to access the Stock Screener 2.0. Its free version includes ads and has limited features (such as only one saved chart layout and no custom time intervals) but still enables you to explore the platform and leverage key features such as replays.
There are also three paid plans for personal use:
- Essential (starts at $12.95 per month): It includes two charts per tab, five indicators per chart, 20 price and technical alerts, and ten parallel chart connections.
- Plus (starts at $24.95 per month): It includes four charts per tab, ten indicators per chart, 100 price and technical alerts, and 20 parallel chart connections. It also includes extra features like charts based on custom formulas and CSV chart data export.
- Premium (starts at $49.95 per month): It includes eight charts per tab, 25 indicators per chart, 400 price and technical alerts, and 50 parallel chart connections. It comes with additional features like auto chart patterns and second-based intervals and alerts.
Note that all these prices are in the annual billing options. You can also opt for monthly billing for rates approximately 19% higher. All the paid plans are ads-free and offer a free 30-day trial.
Additionally, the company offers professional plans starting at $199.95 per month that include additional perks like higher usage limits, the ability to buy professional market data, and first-priority support.
Final thoughts – Is TradingView the best stock screener?
TradingView has managed to create a platform that is, at the same time, easy and intuitive for beginners, and robust for experienced investors, featuring all the data and functionalities they need to make the most data-driven decisions.
Furthermore, it has one of the broadest coverages among screeners, featuring different asset classes from all over the world, and is highly rated by its users.
While we haven’t reviewed all the stock screeners available, we can say for sure that whether you’ve just begun trading or have been doing it for years, TradingView Screener is an assertive choice that’ll likely exceed your expectations.
Further reading:
- 5 Top Stock Picks That Could Grow Despite Economic Downturns
- 5 Best ETFs to Invest: In the Wake of a Potential Recession or Economic Downturn
- Best Way to Invest 20K & What to Avoid at All Cost